Dashboard
The Dashboard is a component that enables to get a quick overview of what is happening on the network of your infrastructure and supports both temporal and resource filtering. The sections of this component are described as depicted in the following screenshot :
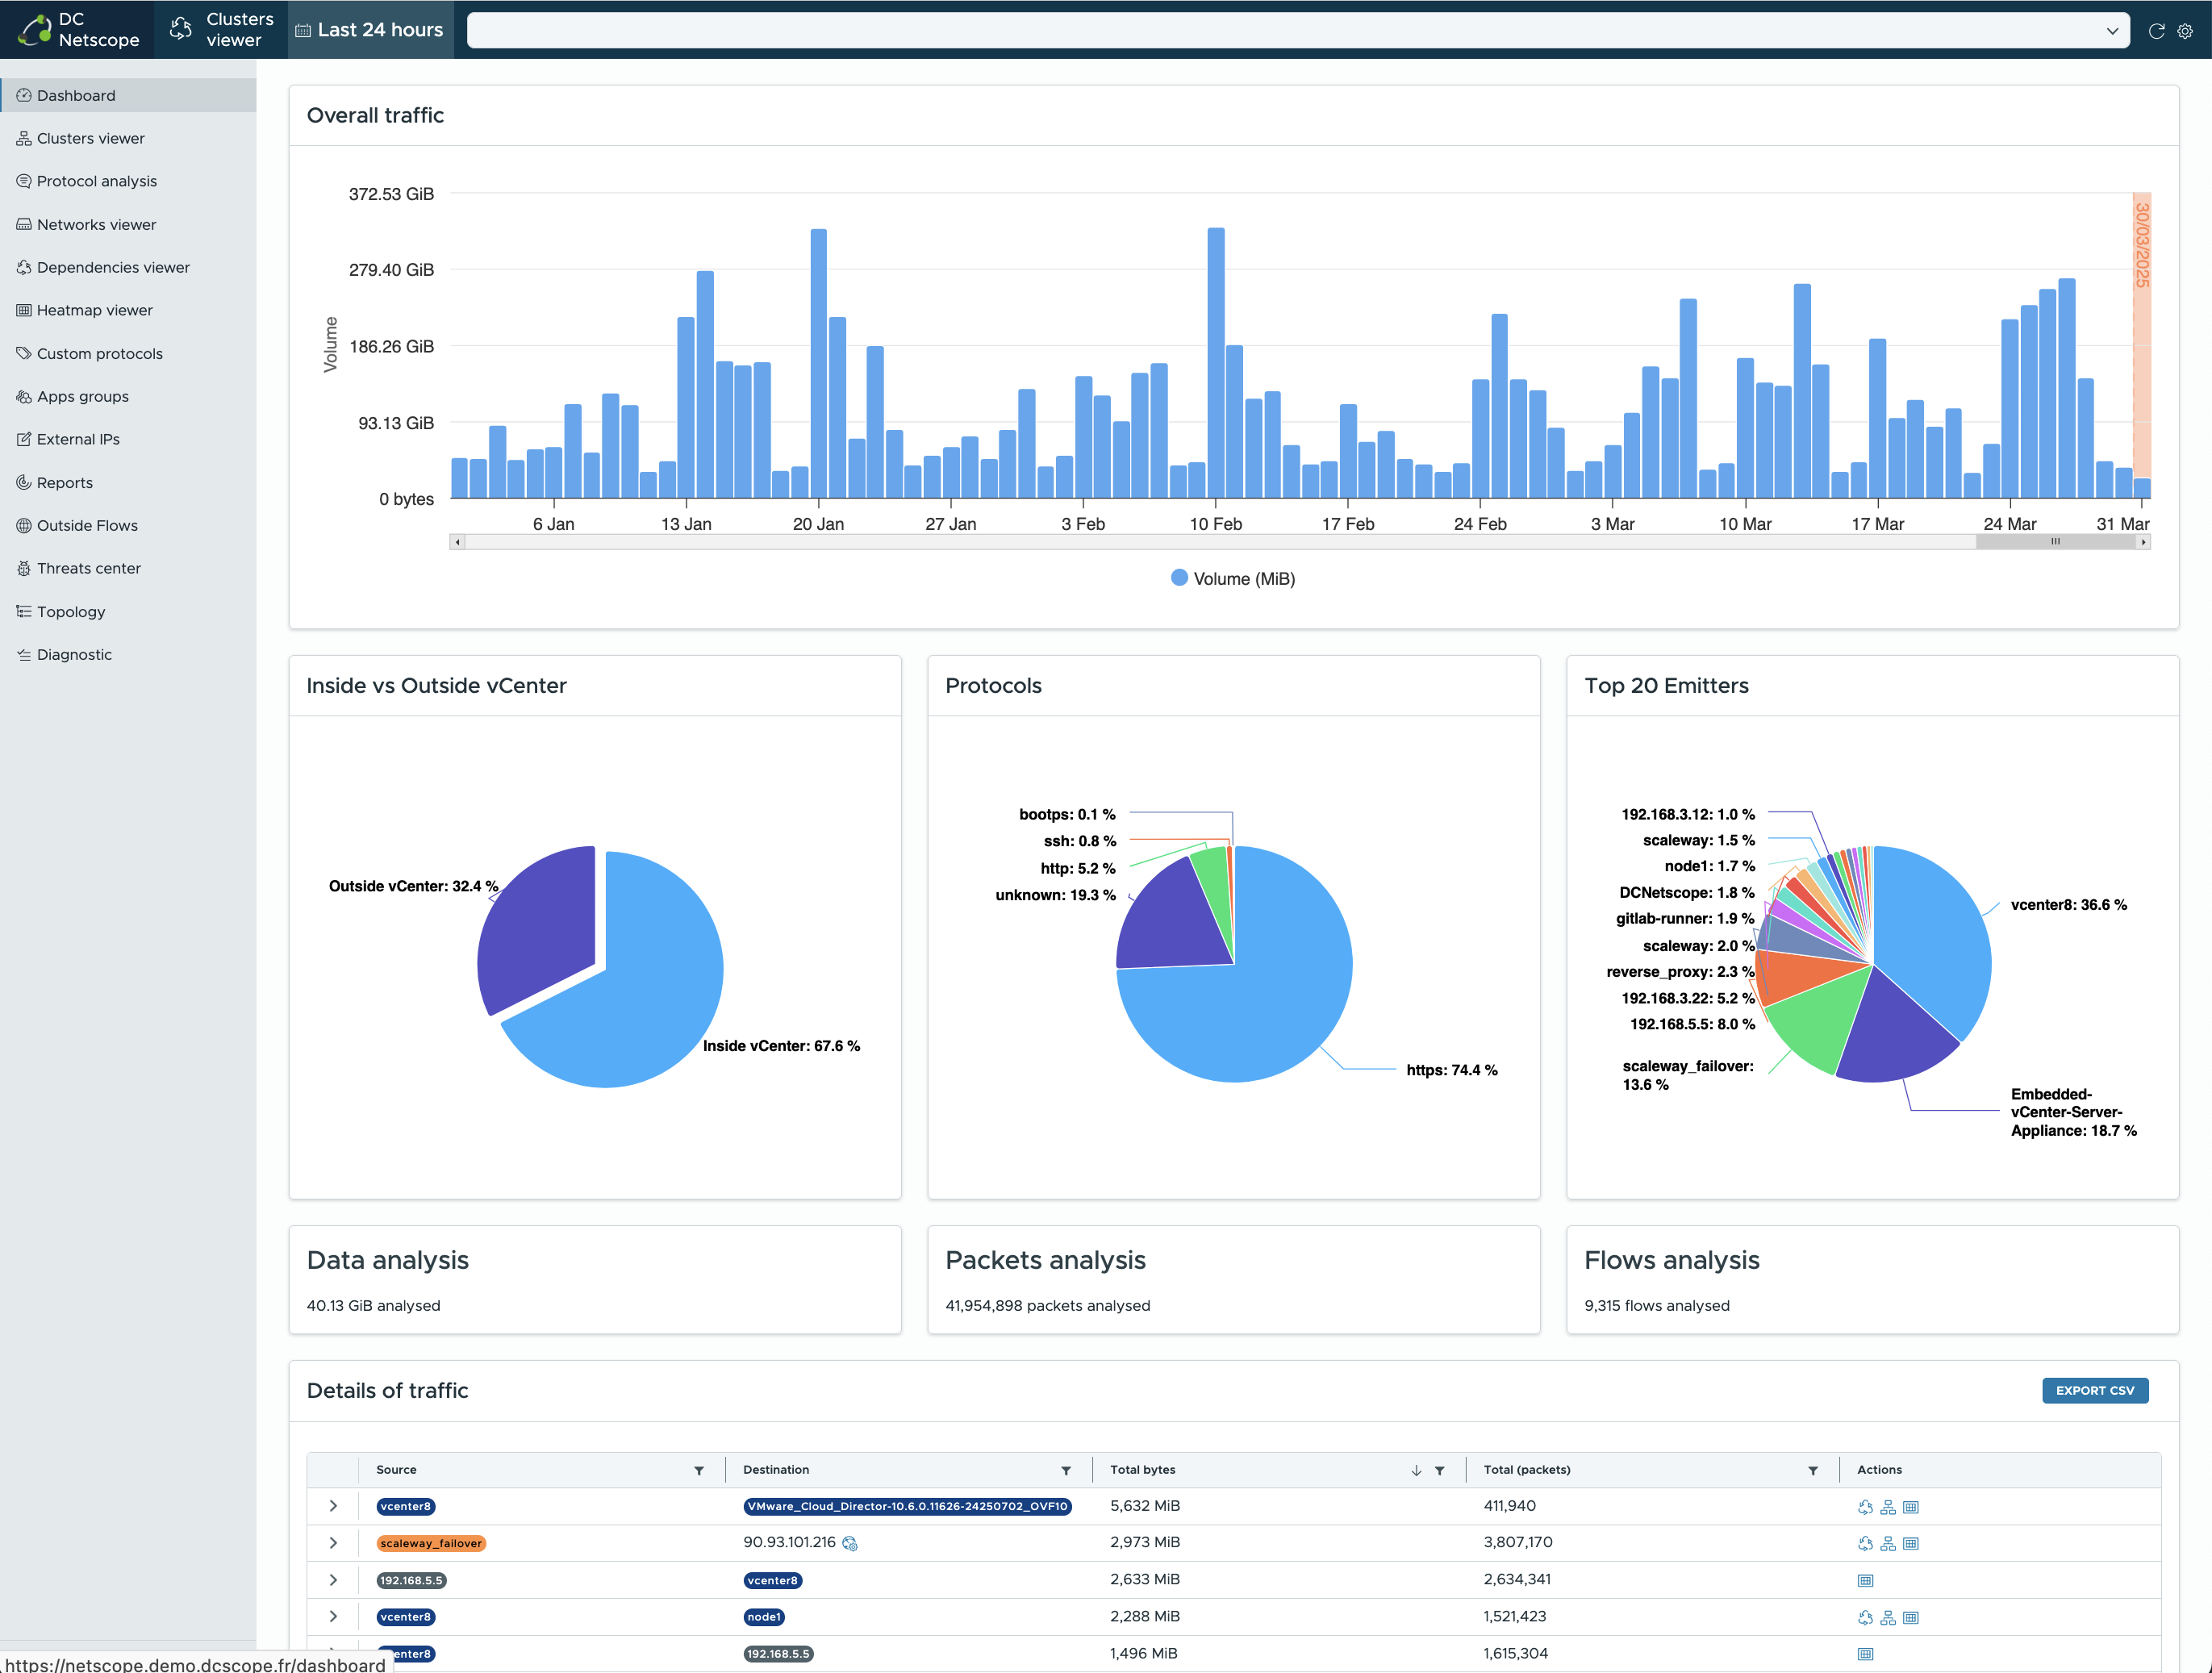
Traffic over time
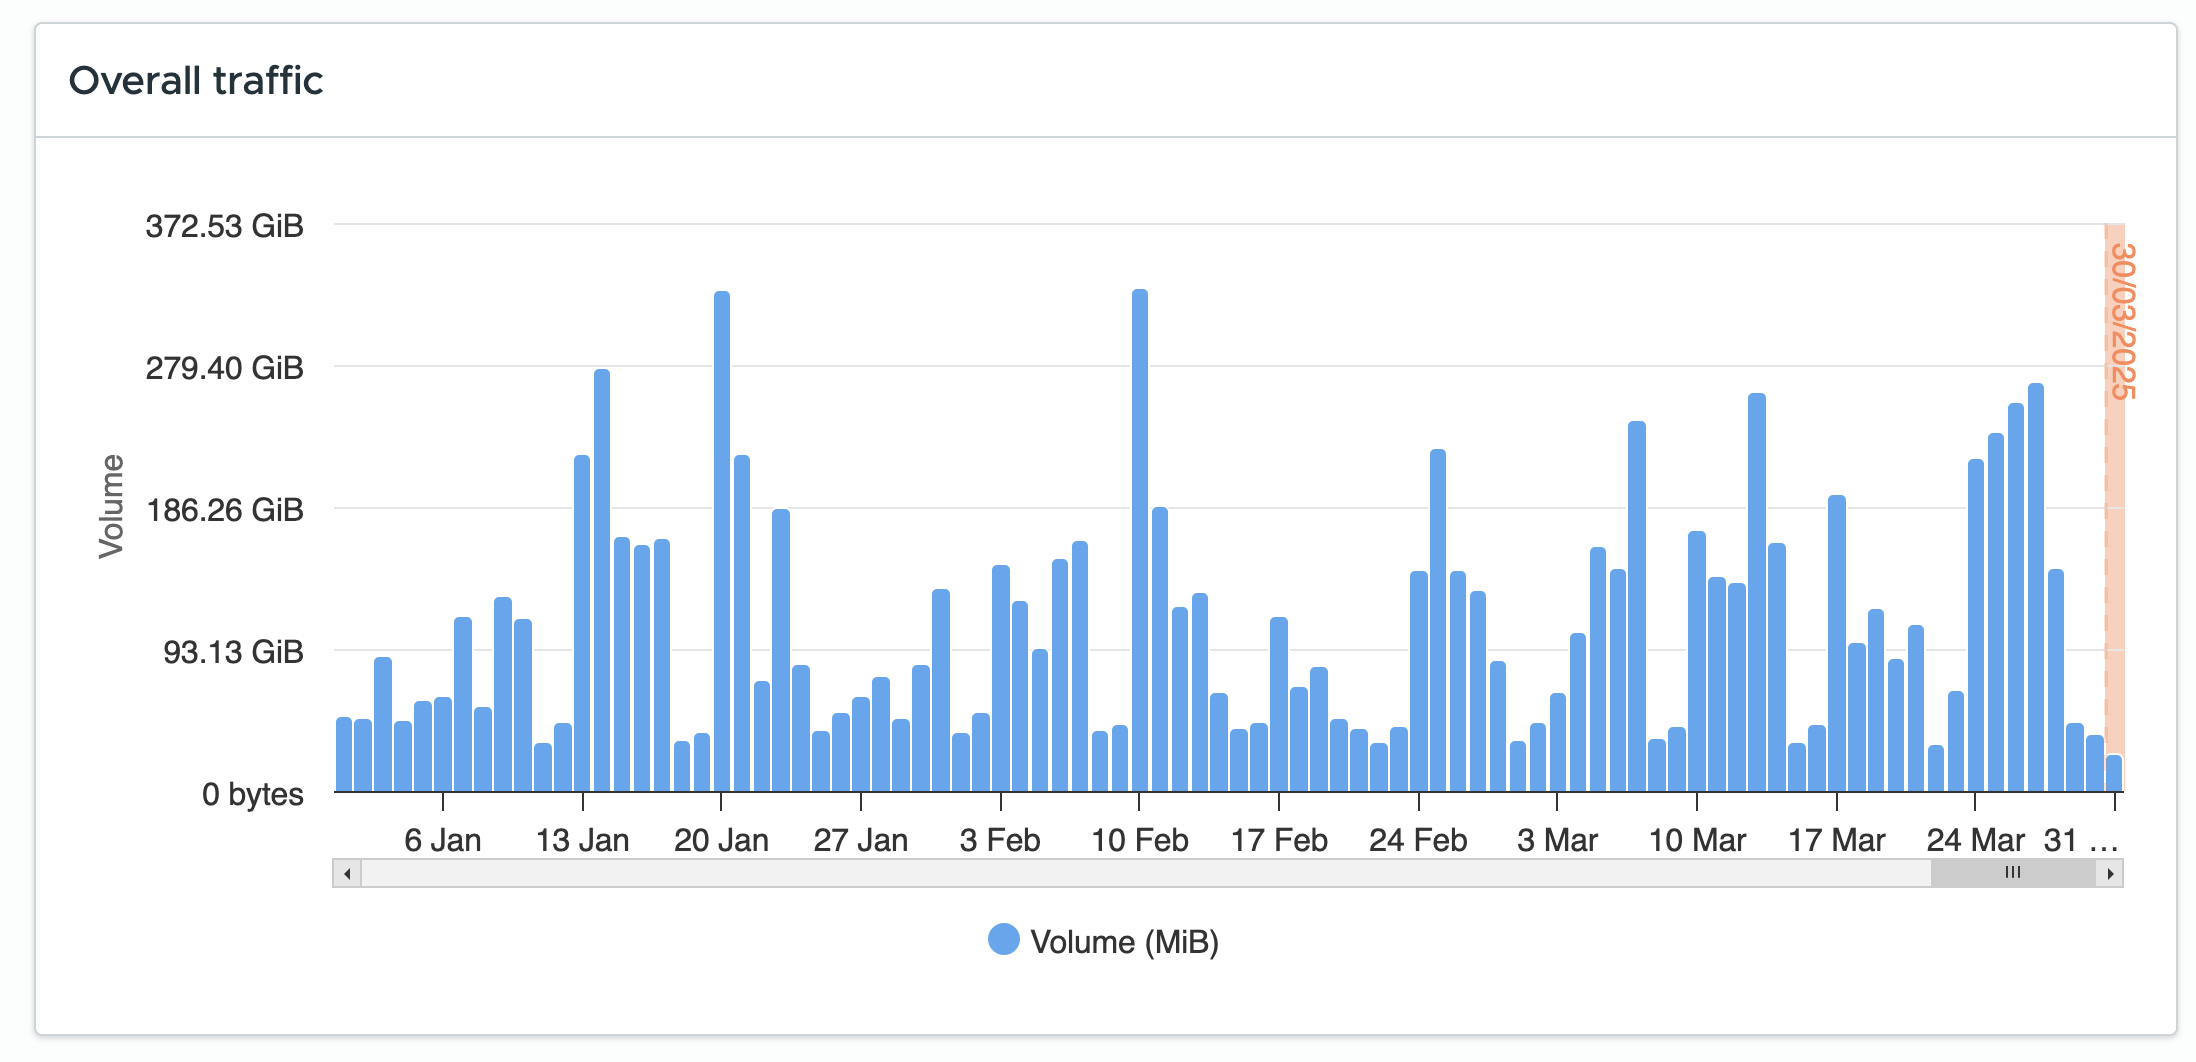
This graphics shows the network traffic for each day when DC Netscope has collected some data. The orange rectangle highlights the current time selection. It is possible to click on a blue bar to select a specific day as a time filter.
Summary of network flows
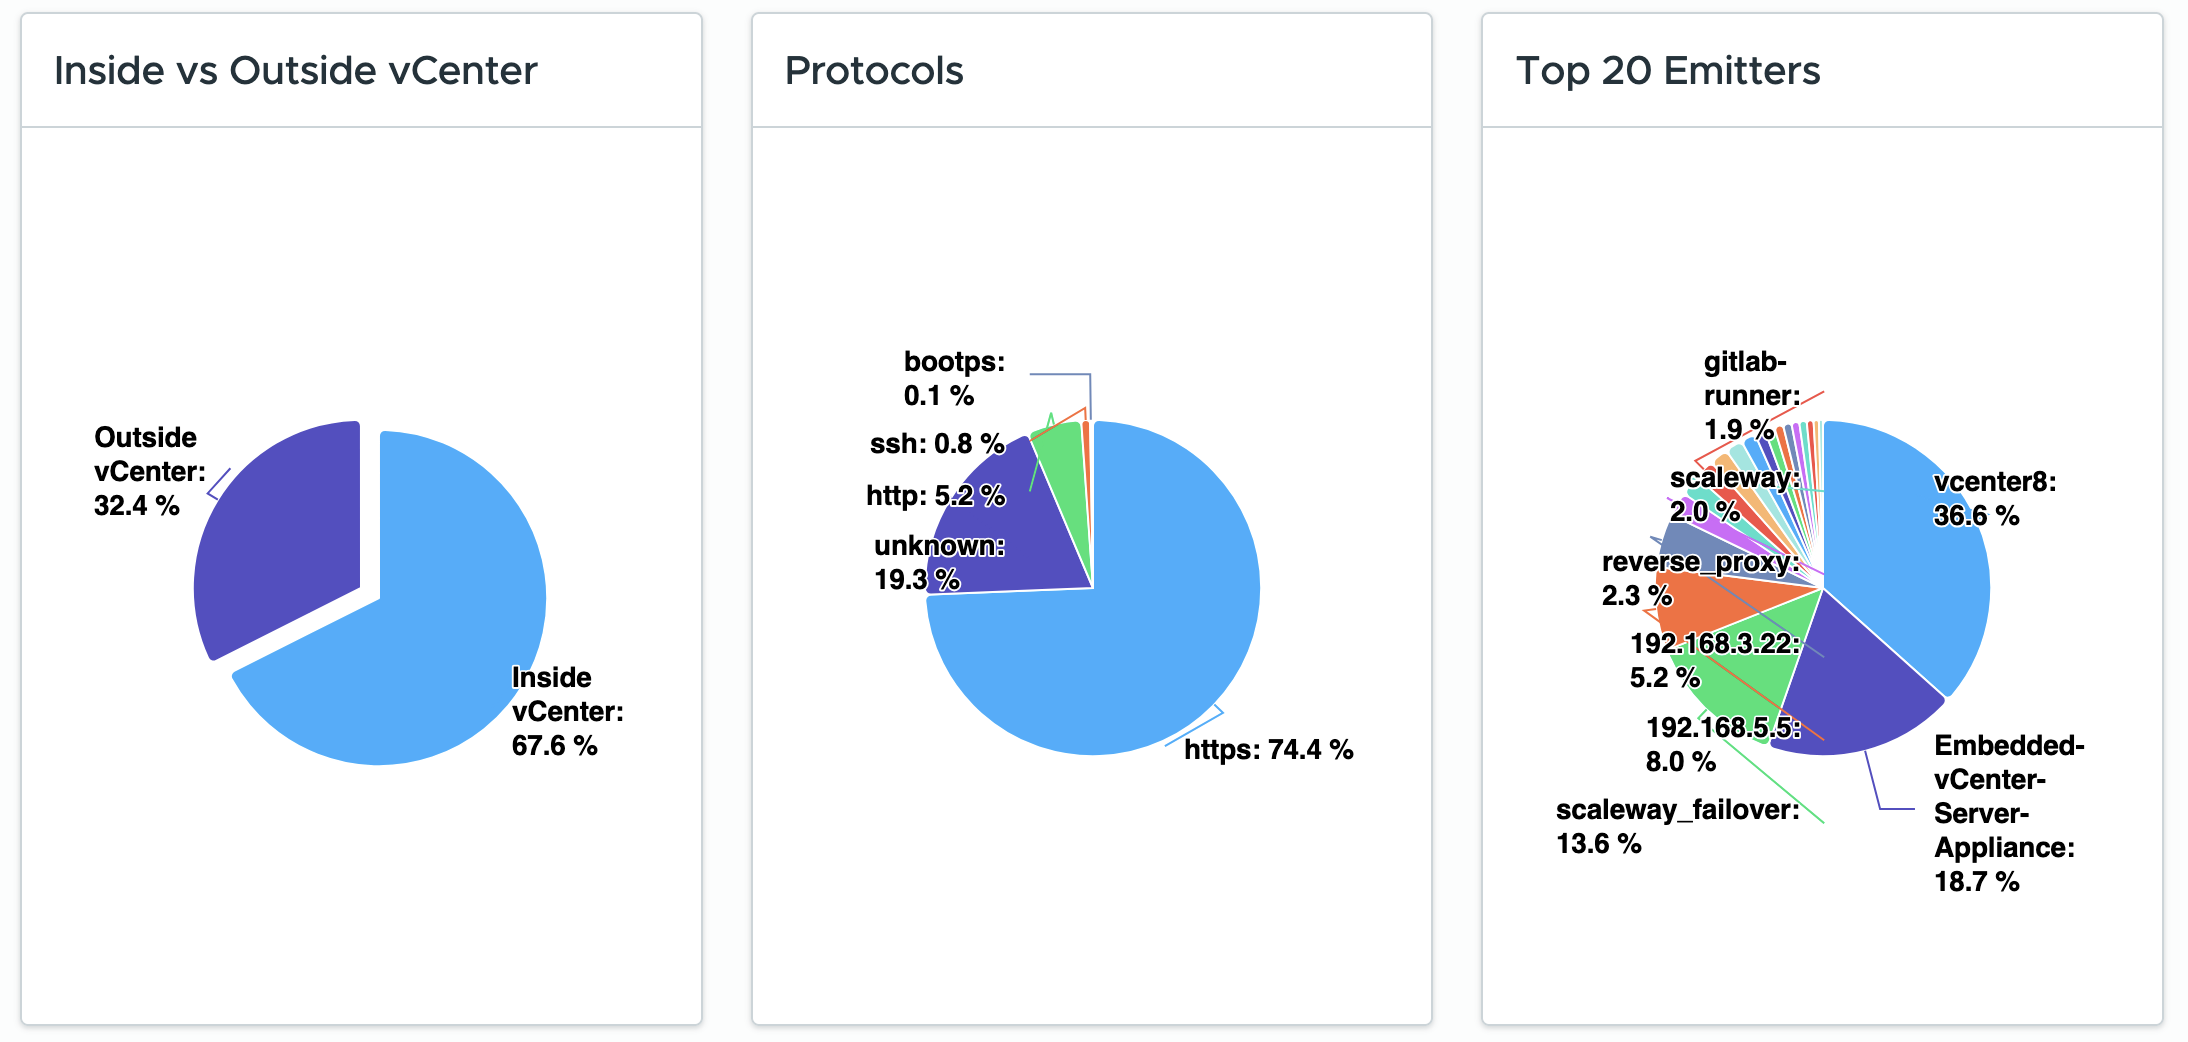
This Section gives a quick overview of the network traffic. It is composed of three graphics :
- Inside vs Outside infrastructure : it shows traffic that stay inside your infrastructure vs traffic between some of your resources and the outside. Please note that by inside resources we cout : vms and host known of the vcenter, resources configured in External IPs, and IPs that are not in Internet.
- Protocols : it shows the most used protocols. DC Netscope tries to find a match betwen source and destination ports, and a known protocol. Please note that you can creat Custom Protocols rules to reduce the unknown protocol.
- Top 20 emitters : it shows the resources that are the cause of most of the traffic in your infrastructure.
Summary of SFlow/Netflow collect
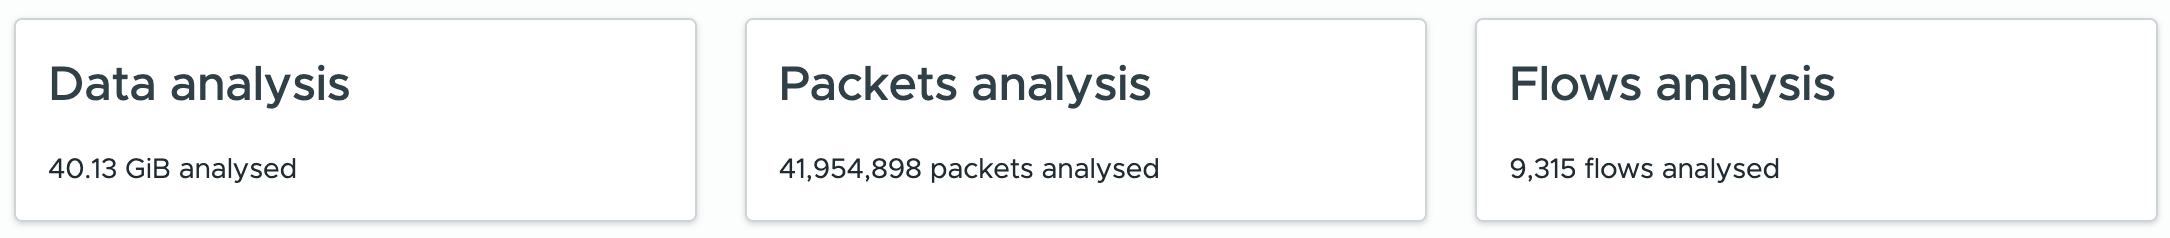
These cards show the amount of traffic covered by Netflow/SFlow metadata received by the collectors embedded on DC Netscope. It can be useful to check the status of the collect, and to measure the coverage of the infrastructure.
Network flows datagrid
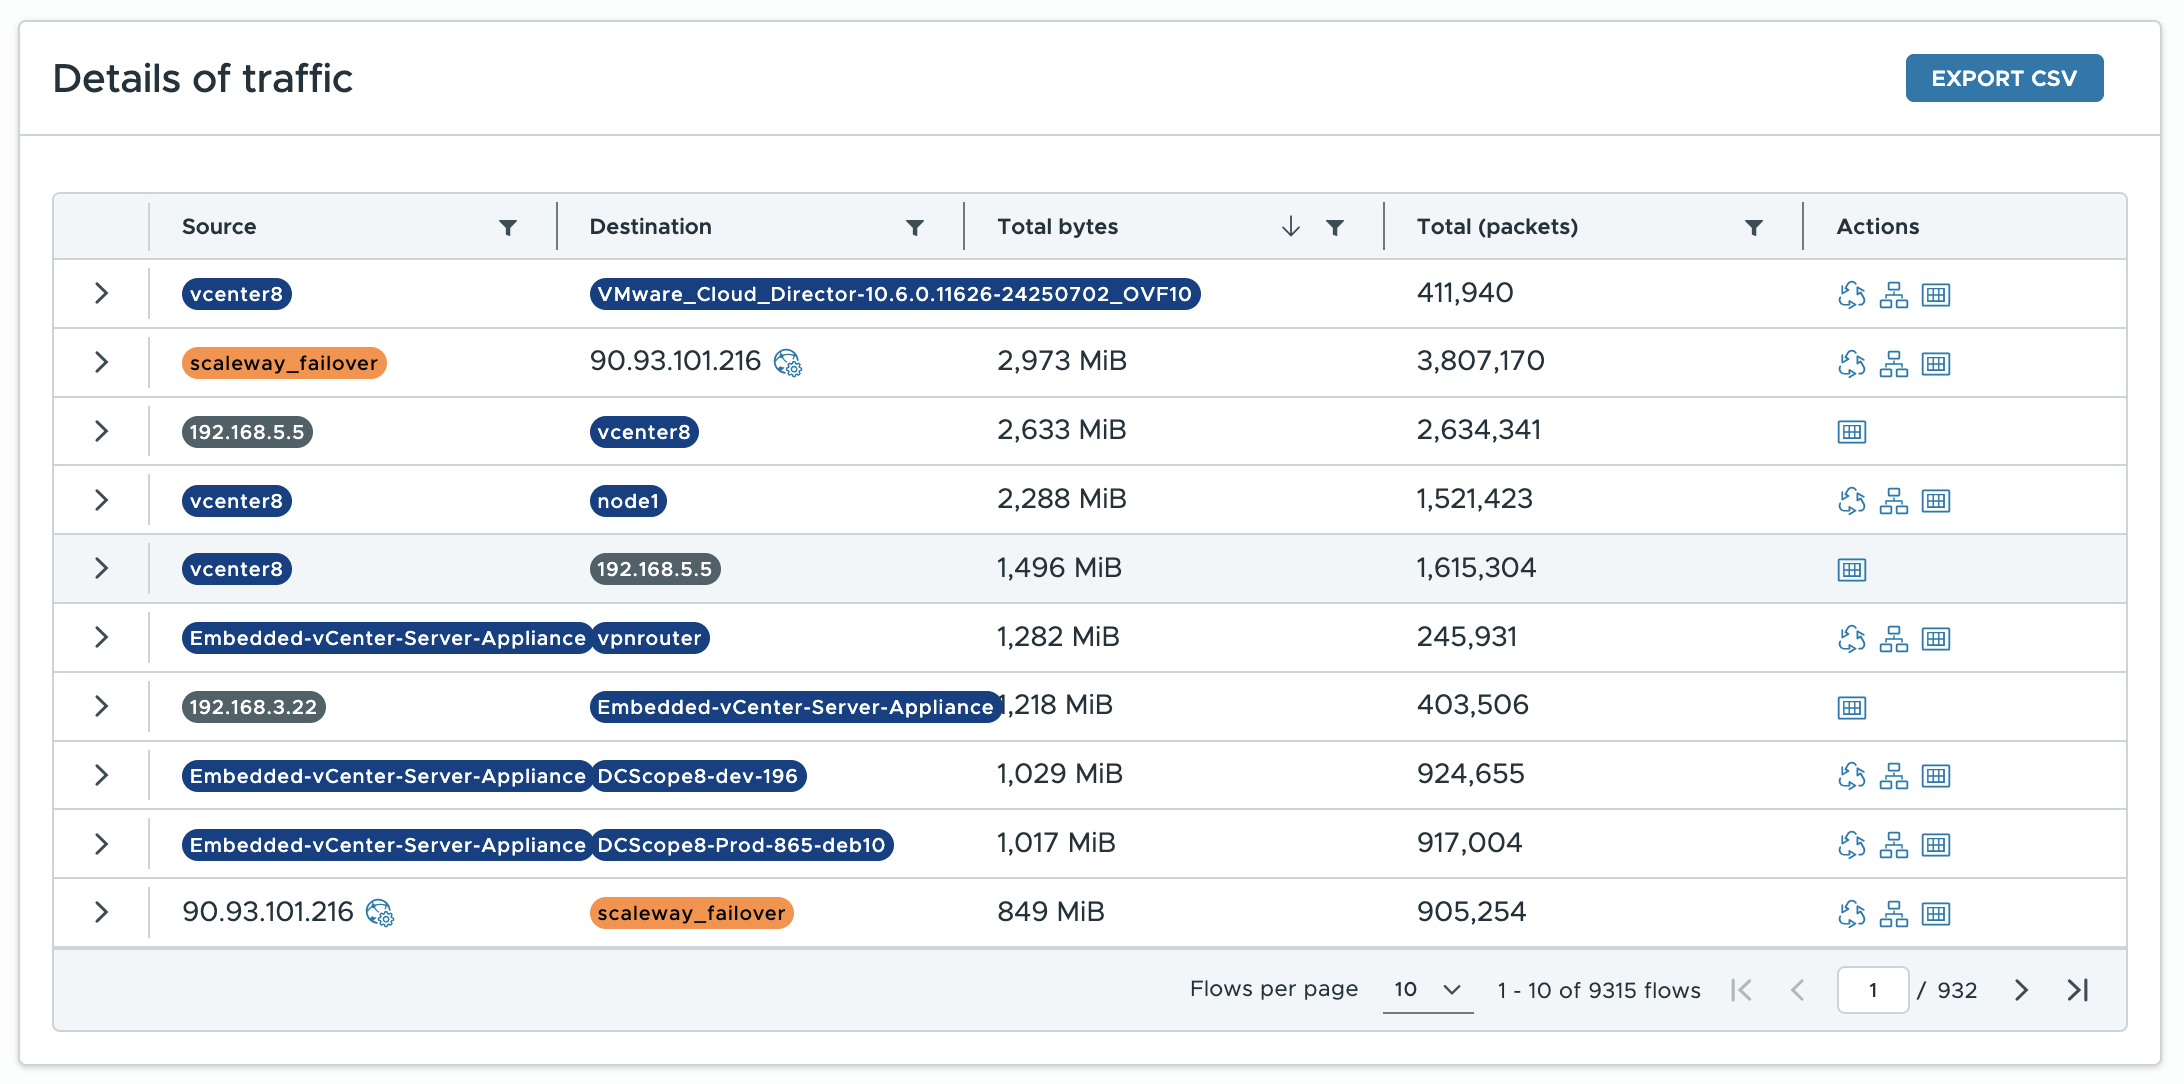
These datagrids gives the datails of the flows that have been measured for the given filtering. Each row represents a summary of flows between a source and a destination.
It is possible to have a detailed view per port of the flow, by clicking on the icon on the left :
It is possible to filter rows that appears in the columns, as in the following video :
These datatables can be exported as CSV files by clicking on the export csv button.