Introduction
DC Netscope is a tool designed to provide observability of network flows inside your infrastrucuture. While the large number of flows can be overwhelming, DC Netscope provides different components that can help to focus on some key data, and understand specific interactions among your applications.
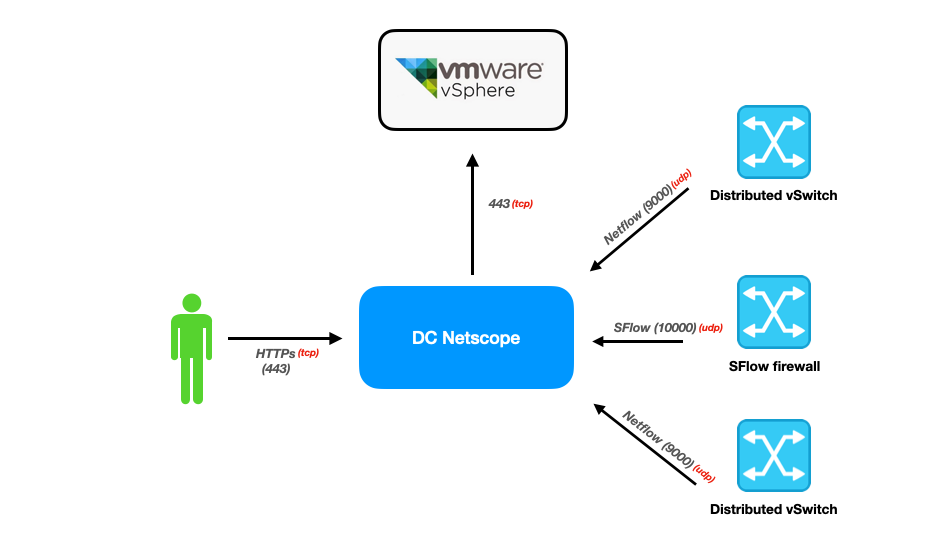
A DC Netscope deployment has this typical architecture :

In this Section, we detail the general principals followed by components of DC Netscope.
Temporal filtering
DC Netscope enables to select specific period of time and visualise the flows that were happening during this time. It supports the following time selections :
- Last sliding day
- Last sliding week
- Last sliding month
- Last sliding year (in situations with large infrastructures, it may not work)
- Custom time period
Resources filtering
DC Netscope support the filtering of one or several resources. Resources filter can be one or several of the following :
- focus on a resource
- ignore a resource
- flows with a resource as source
- flows with a resource as destination
- focus on a protocol
DC Netscope accepts multiple filters, and the resulting dataset is a union of the individual results from each filter. This means that the final output includes all items that match any of the applied filters, similar to how an 'OR' operator functions in SQL.
Visualisation vs Datatables
Each time DC Netscope provides a visualisation, it also provides the raw data used to build the visualisation as datatables. It is accessible as follows :
- Dashboard component : by clicking on the visualisation, a modal with the datagrid appears.
- Flows visualisations : by clicking on the
Flows Datatabletab, a new tab with the datagrid appears.
Note
Data that appears in datatables can be exported as CSV files
Shortcuts

DC Netscope provides shortcuts to its components, which enables to select a specific flow (source and destination) and visualise this flows with high level graphics. These shortcuts are available in particular in the flows views.