Flows visualisations
DC Netscope provides visualisations that can help to understand network flows of the infrastructures. Flows visualisation take into account the temporal and resource filtering that has been defined in the top bar.
While the visualisation provides a high level view of the flows that can give the intuition how what should be investigated, we provide the underlying raw data in tabular format. This ensures a more rigorous and detailed foundation for analysis. Each time an interaction is made in the visualisation, rows of the datagrid are updated.

This Section depicts the different visualisations of flows.
Clusters viewer
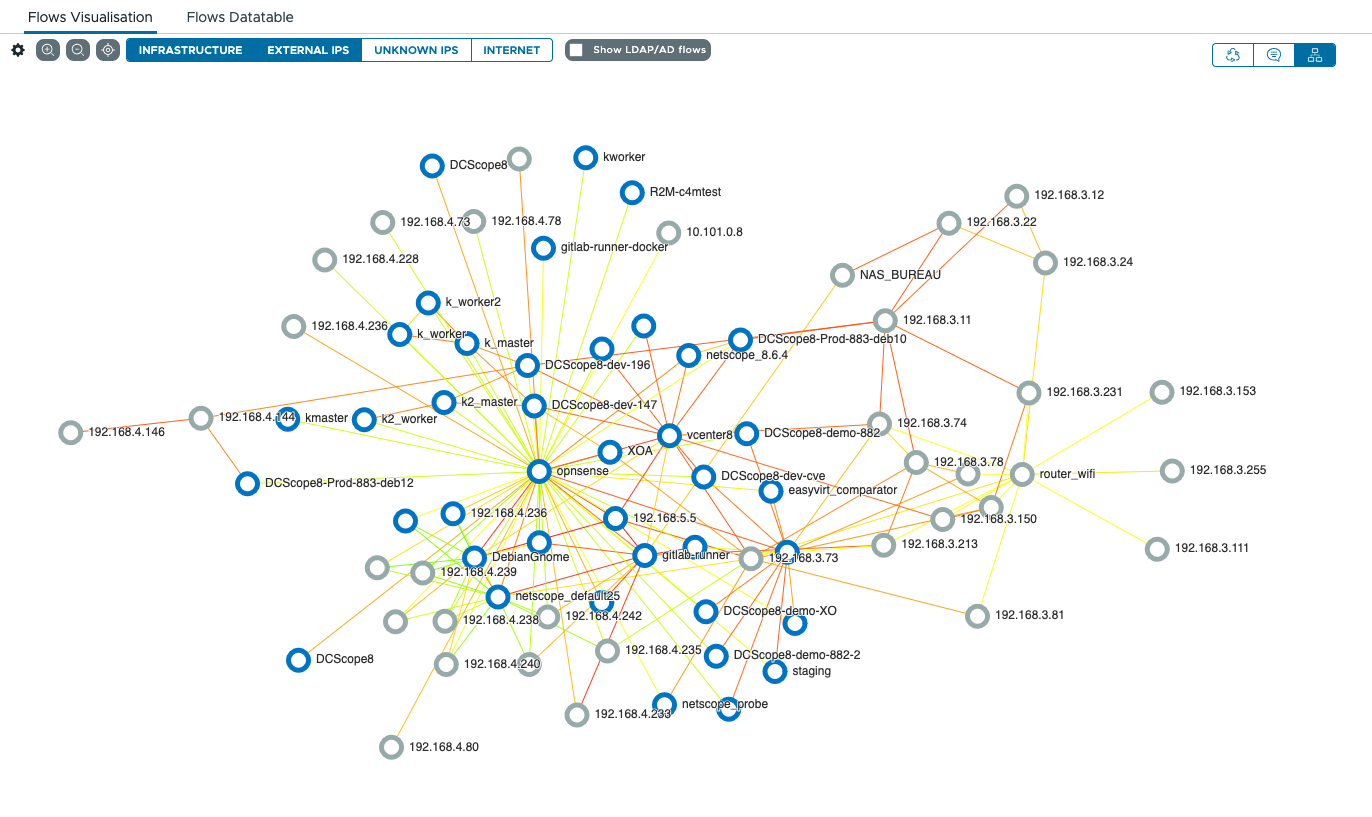
Clusters viewer shows each ressources of the infrastructure as a circle and for each flows, it draws a line that links the source and the target. The links act like elastic bands, attracting and pulling the connected resources towards each other, thus creating clusters.

By default, only resource from the infrastructure (VMs, ESXIs, non Internet IPs) are shown as circle. It is possible to display outside resources as in the following video. By default, IPs are grouped by ASN (network providers), however it is possible to see the real IP. IP addresses can be resolved, to see the corresponding domain name.
Details side panel and focusing on a resource
When you click on a resource or a link, a side panel appears showing the details of the flows and some visualisation about its origins and protocols. If you clicked on a resource (circle), you can ask to focus on this resoruces. This is depicted on the following video :
While you are focusing on a resource, it is possible to add more resources to the focus.
Protocol Analysis
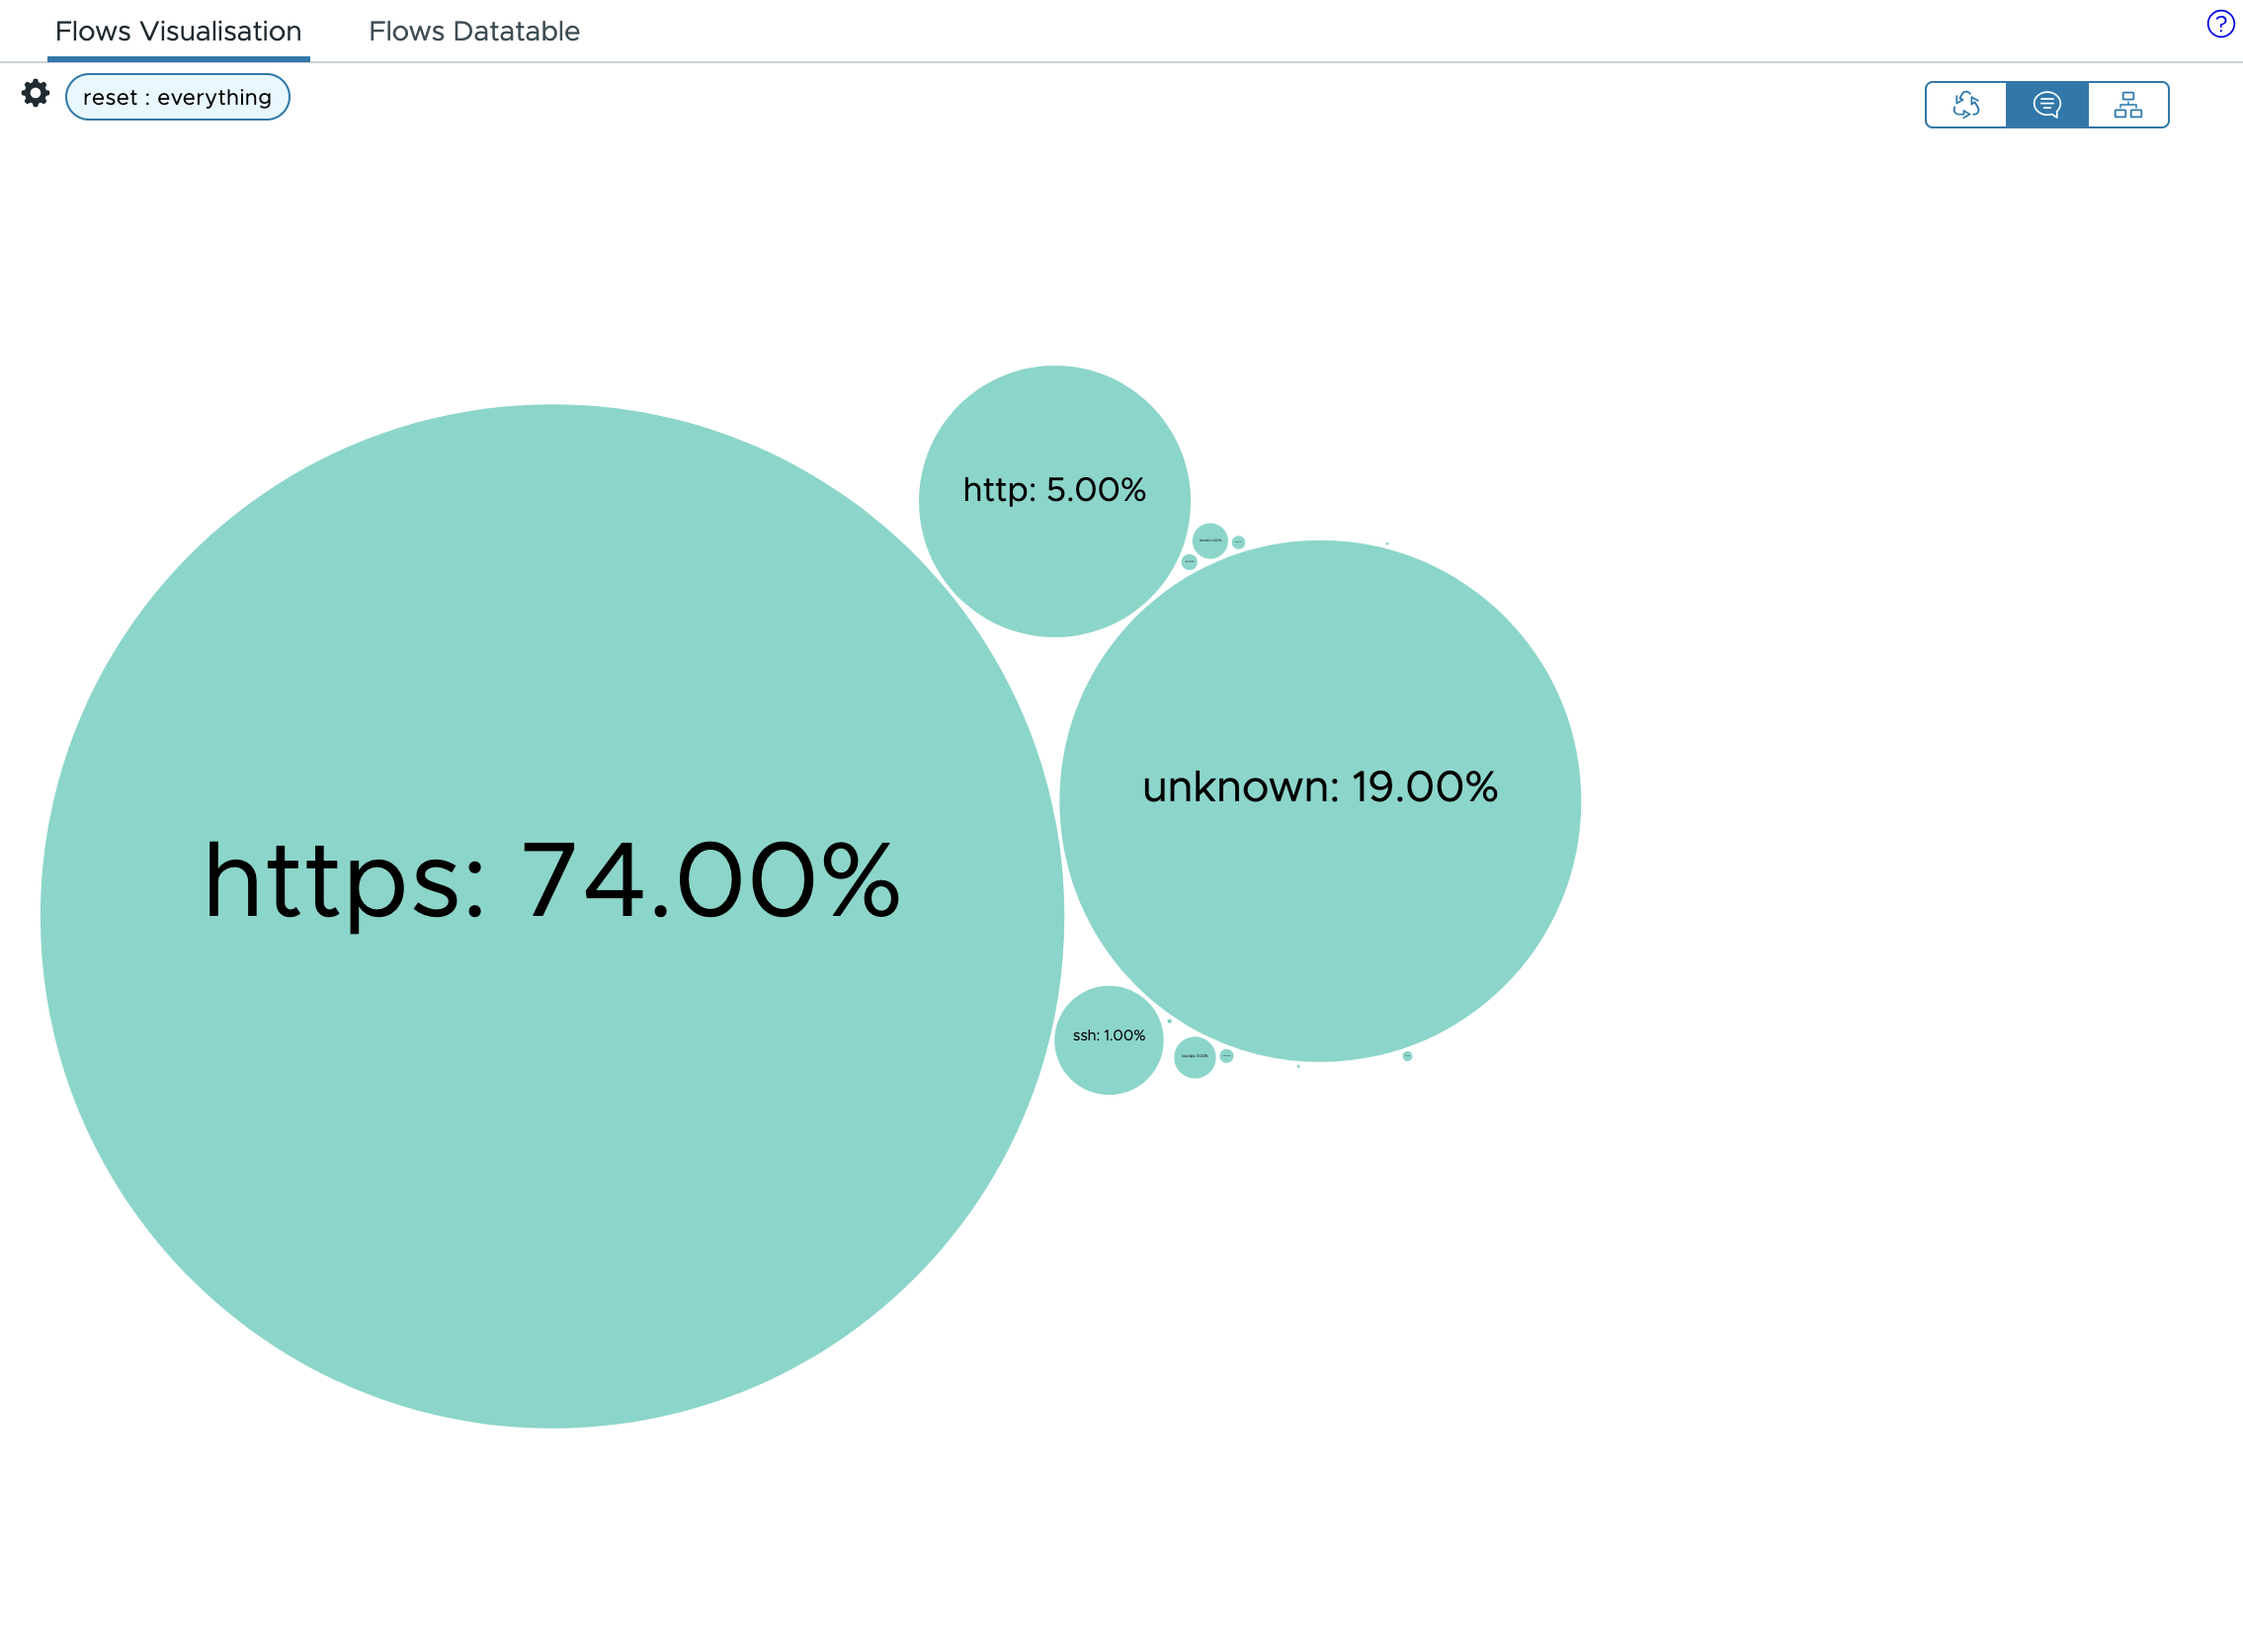
Protocol Analysis show circles that represent the proportion of protocols in the network exchanges. When the user click on a circle, it shows for this given protocol, what are the source of the protocols as sub-circles. If the user click on a sub-circle, it shows for the given protocol and the give source, what are the destinations of the flows.
It is possible to go back by clicking on the outer circles, or by clicking on the navigation bar.
Networks viewer
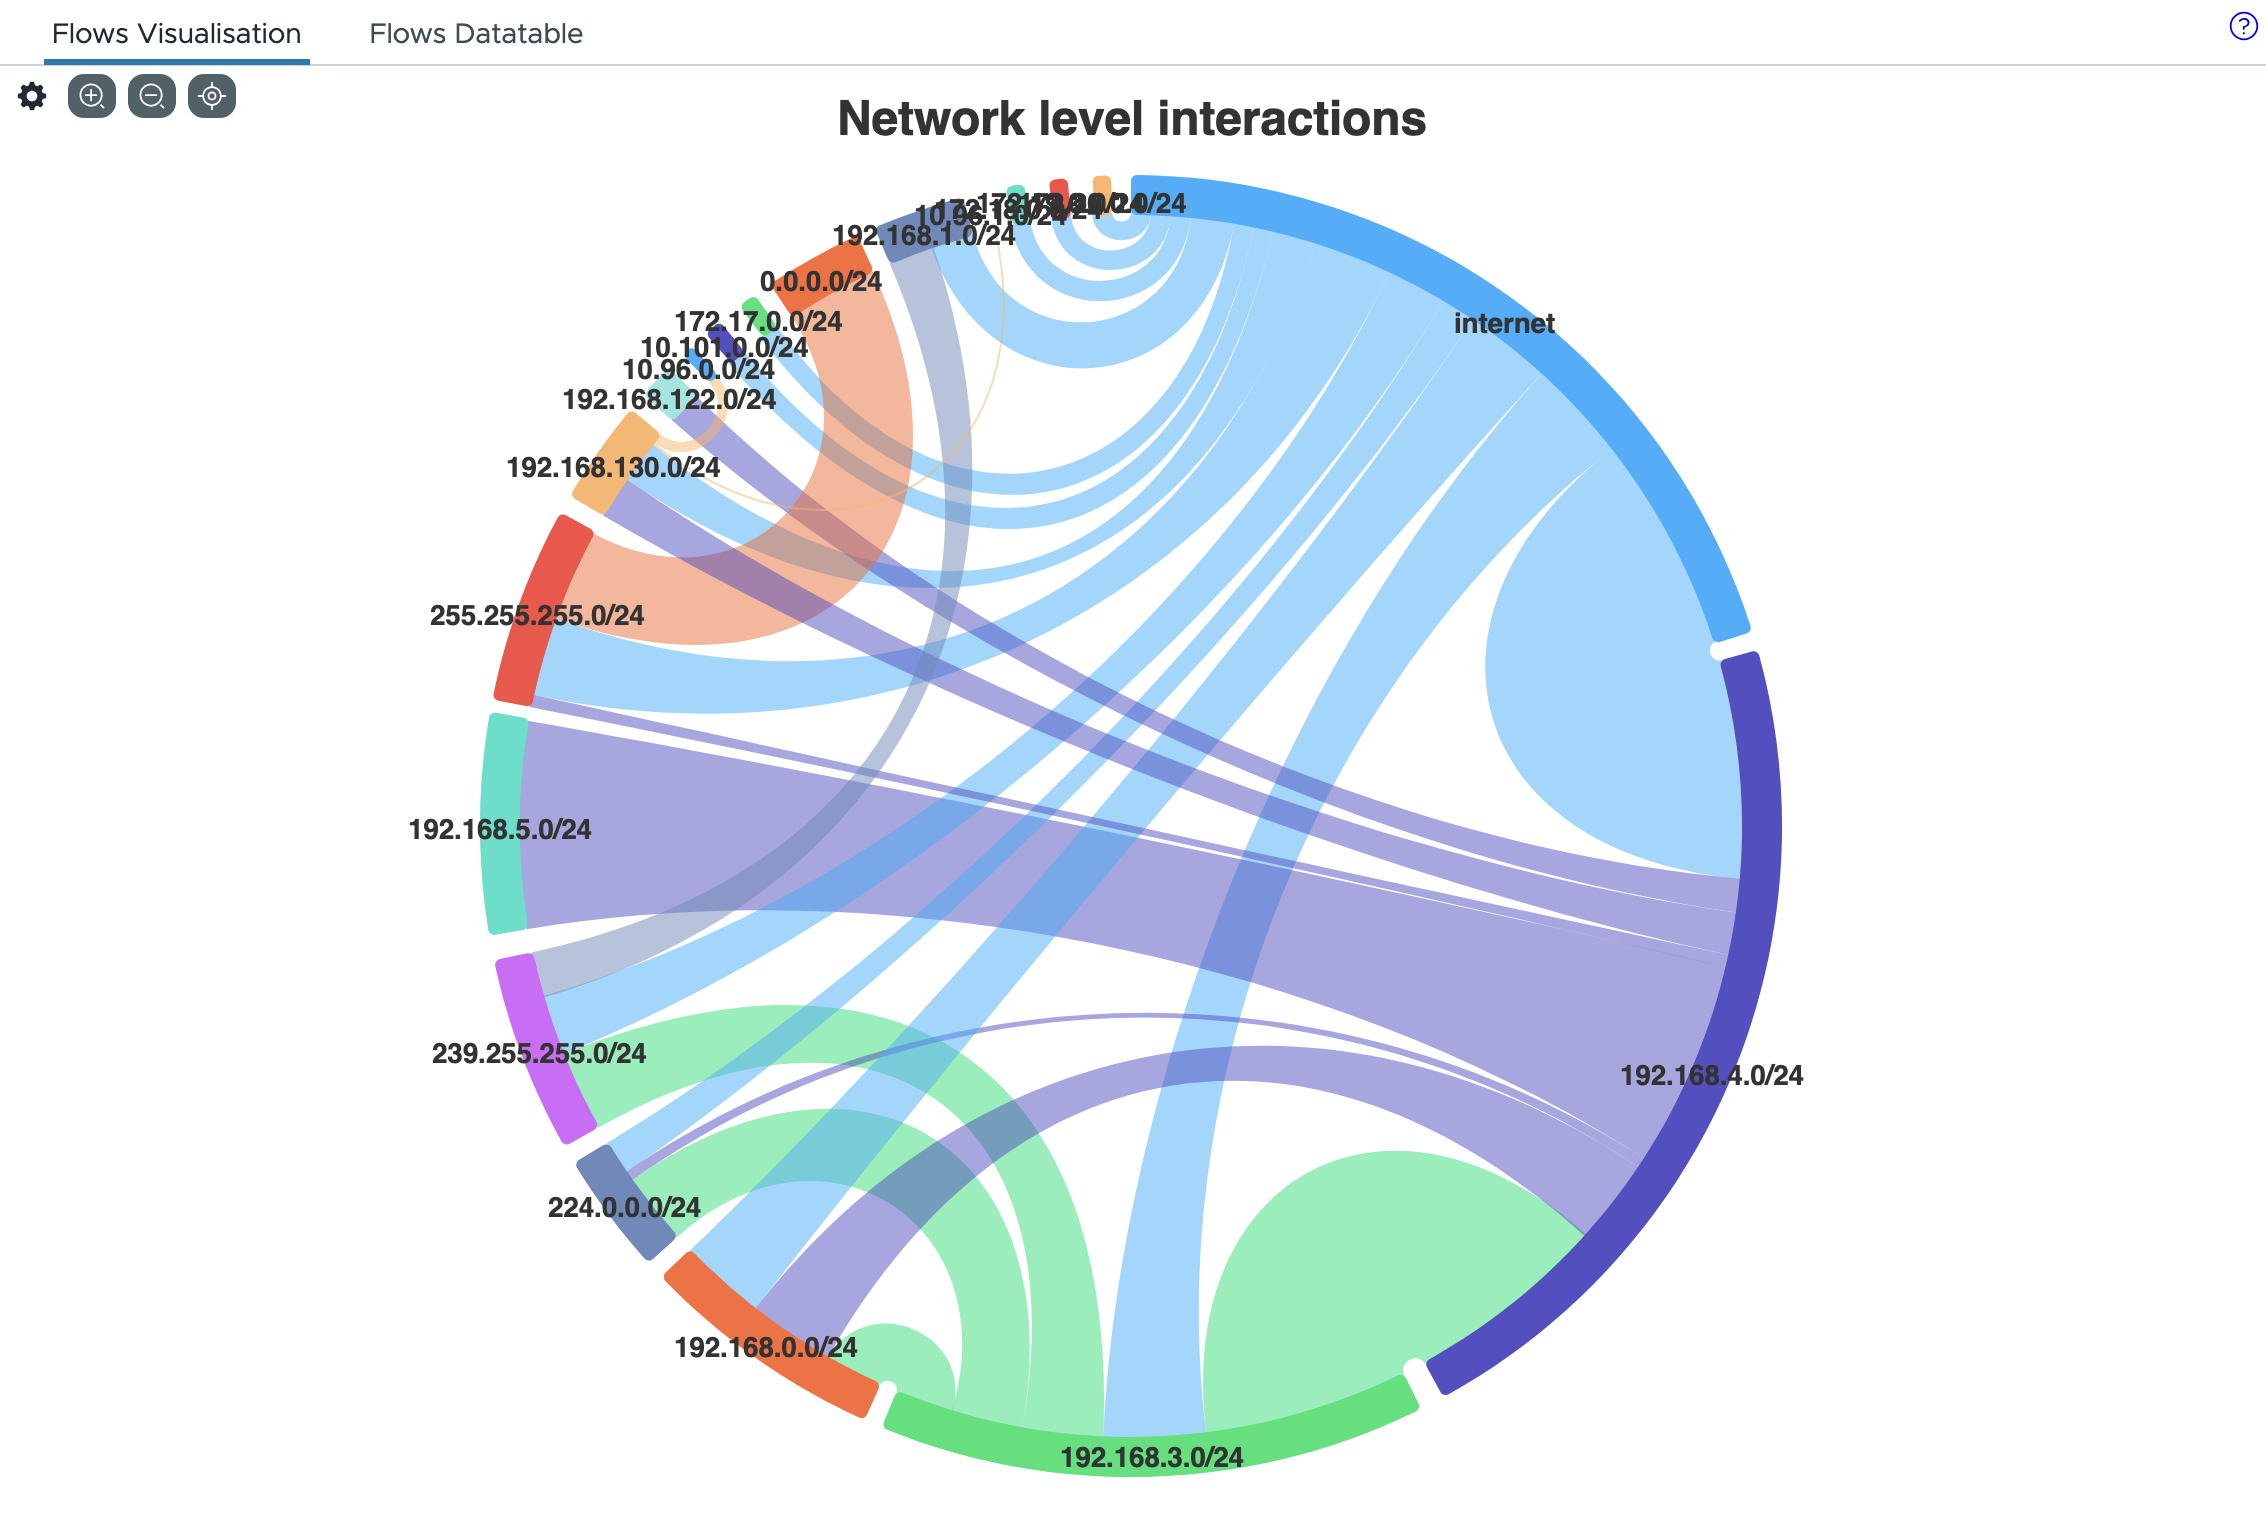
Networks viewer shows the interactions at the network level. For each flows, we take the first numbers of IP addresses,
and regroup by same number. For example 192.168.3.29 and 192.168.3.44 are parts of the 192.168.3.0/24 set, and
192.168.1.56 and 192.168.1.35 are parts of the 192.168.1.0/24 set. Then interactions at the IP sets level are
shown, which is useful to check that firewall rules are respected. IP sets are represented by colored arcs, while
interactions between IP sets are represented by lines that go from an arc to another arc. The size of arc depends of the
amount of data exchanged. IPs that are on Internet (we found an ASN associated to the IP) are grouped in the Internet
arc.
It is possible views the details of flows that are part of an interaction between IP sets by clicking a line. It is also possible to see all flows of an IP set, by clicking on the arc corrsponding to an IP set.
Dependencies viewer
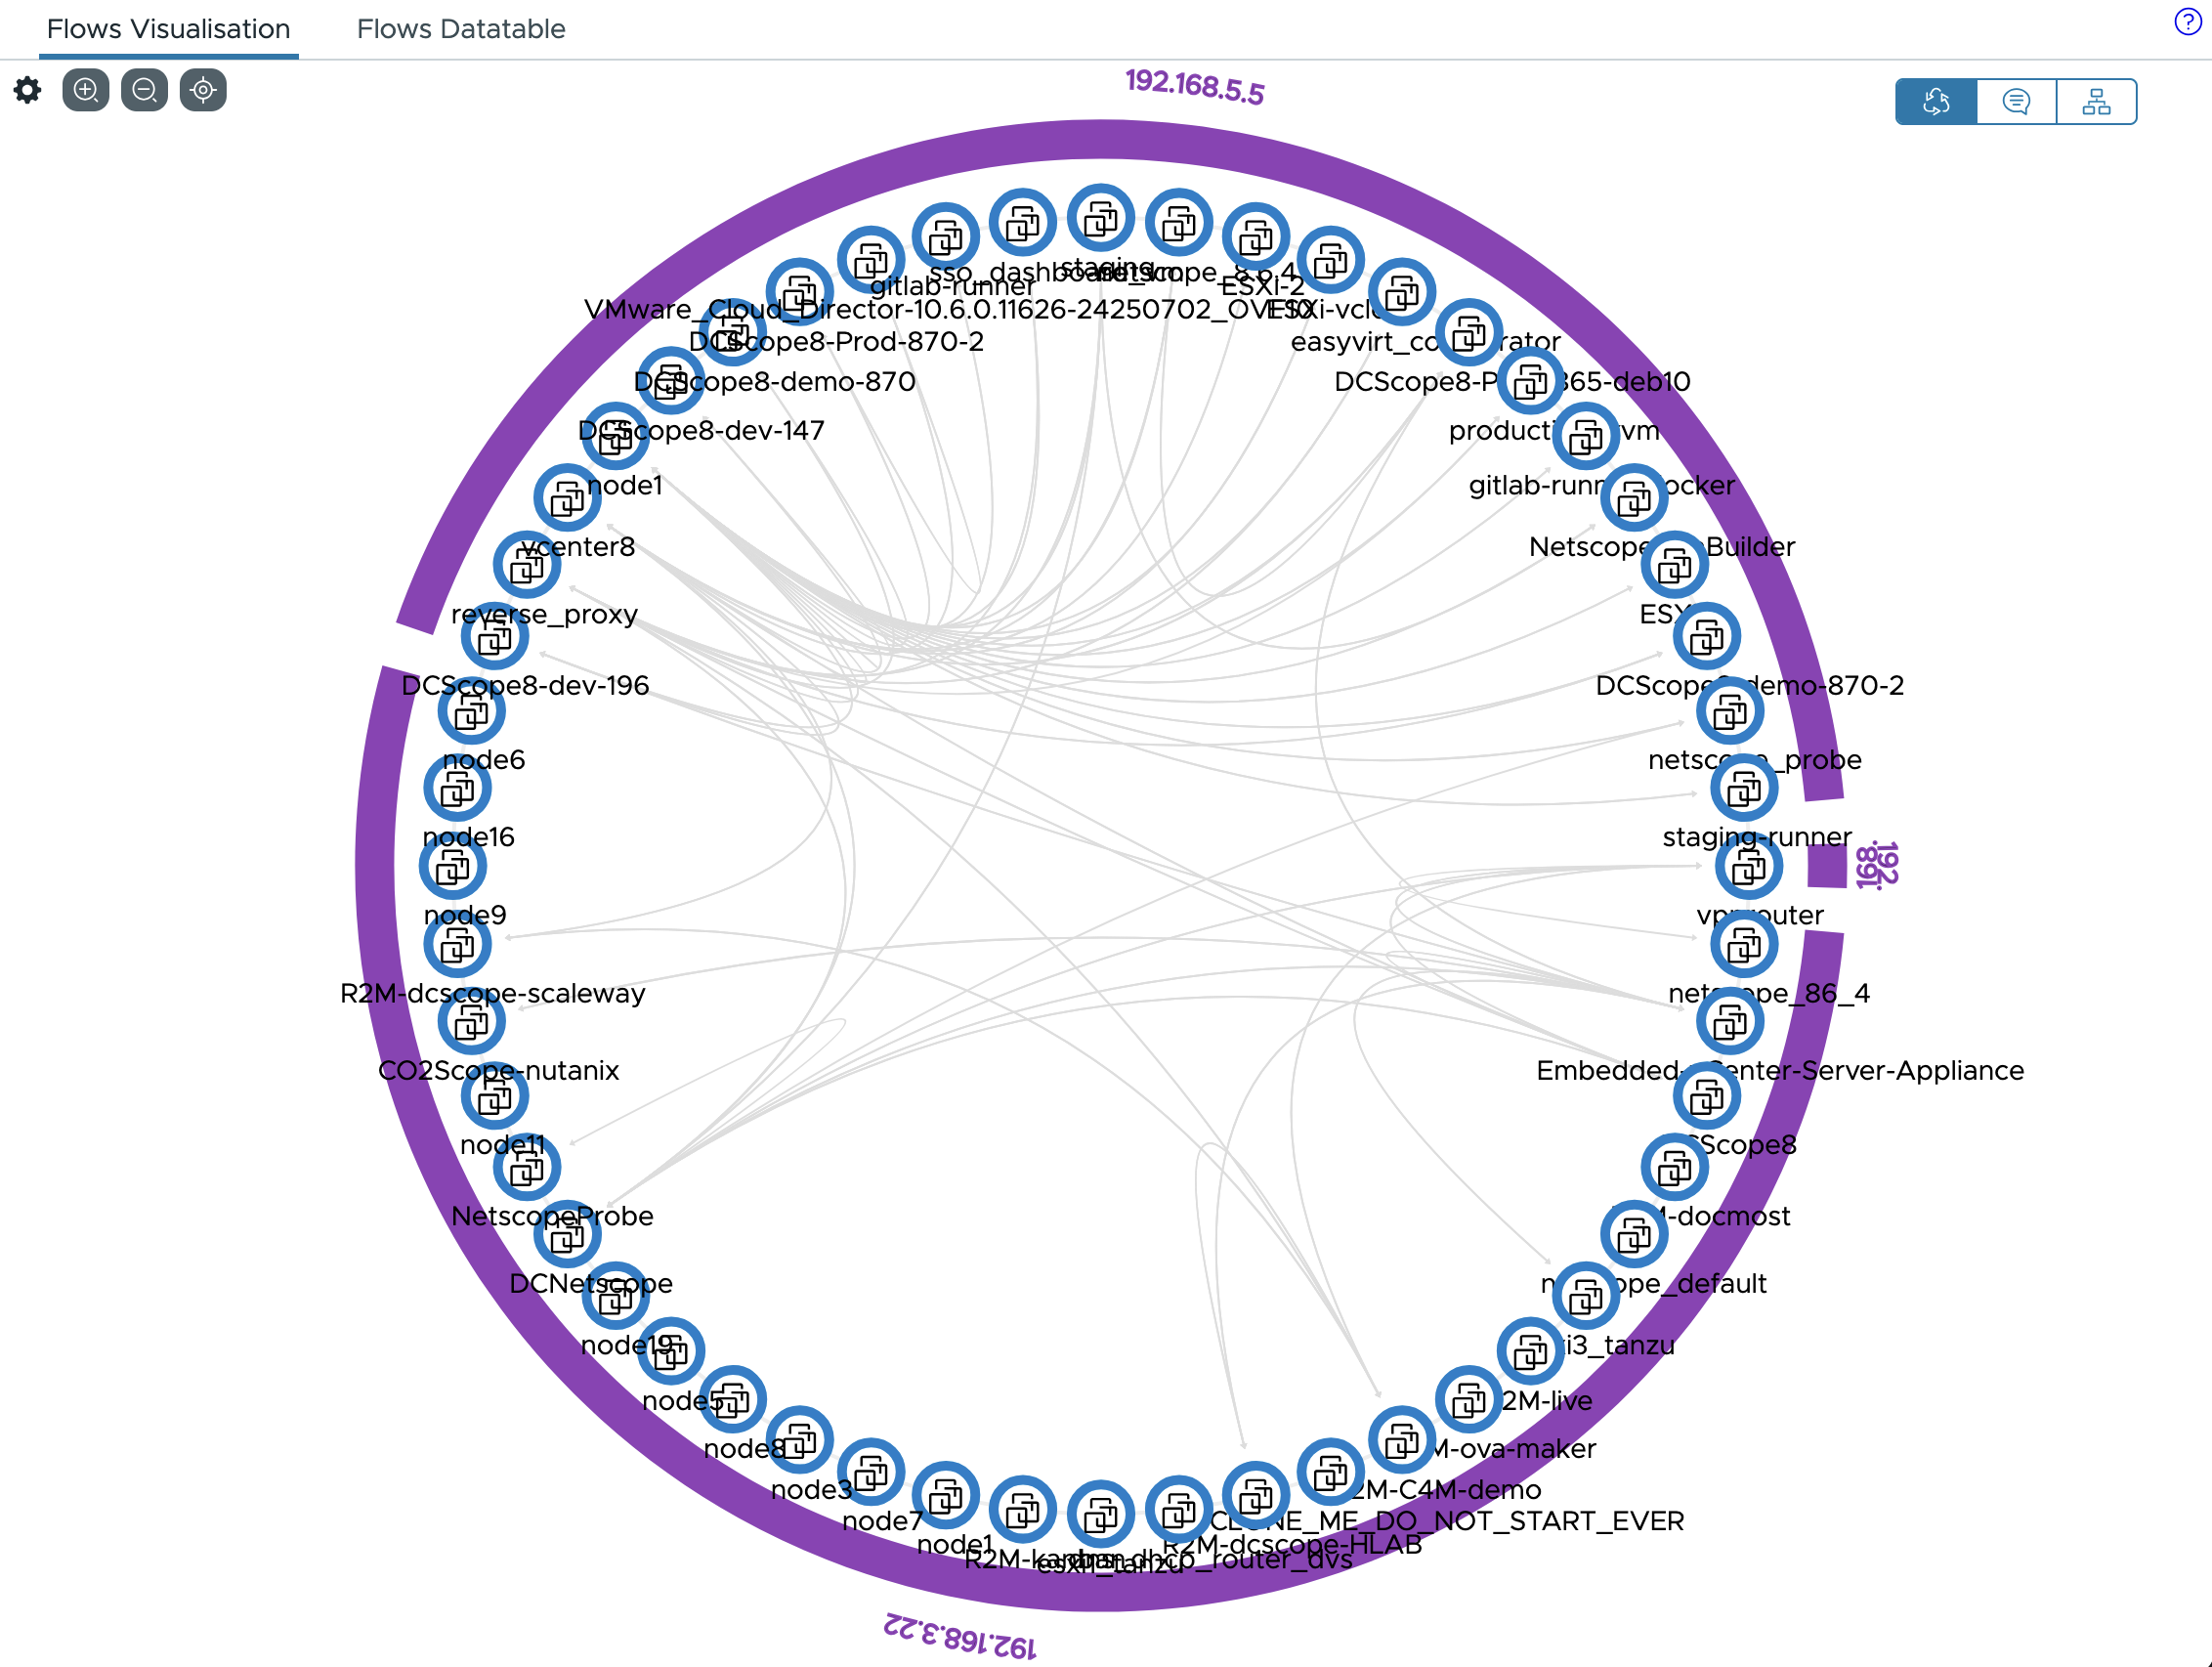
Dependencies viewer is similar to Clusters viewer : it shows interactions between virtual machines and show flows
that stay on the same host, and flows that go from one host to another host. This view is useful for two use cases :
- Fiding inefficient flows, such as an application and its database that are located on different hosts.
- Identifying master and replica that are on the same host.